Monitoring Network Performance at Interop Las Vegas
NetBeez was on-site at Interop Las Vegas, monitoring performance of the show's production network. Here's what we discovered.
May 13, 2016

Last week, the NetBeez team was in Las Vegas to exhibit at Interop. But we were also hard at work monitoring and managing the conference and expo network infrastructure.
Like other IT trade shows, Interop provides wired and wireless connectivity for its exhibitors and attendees. The network is called the InteropNet and plays an important role. In fact, the attendees here can interact on the show floor with the NOC team, the network engineering team that built the network, and learn more about the technologies involved.
This year, the InteropNet and Demo Labs included approximately 80 switches and 60 access points to support more than 6,000 attendees and 200 exhibitors. On top of routing, switching, and wireless, several other technologies were deployed by the InteropNet participants (who are also its sponsors). As in any enterprise network, each technology covered a key area.
1-interopnet-sponsors.JPG
Monitoring the InteropNet
During the show, NetBeez deployed a total of 28 agents to monitor the network. The agents consisted of a mix of wired, wireless, virtual, and external, including:
13 FastE agents in access closets (2A, 2B, 2C, etc.) to verify end-to-end connectivity and performance for internal users;
11 wireless agents connected to the Interop SSID providing connectivity to 6,000+ attendees;
One external agent running from the Virginia Amazon Cloud to verify connection back to the Interop network in Las Vegas;
One virtual agent running on virtual VMWare environment that was supporting other systems employed at InteropNet; and
One GigE agent to do periodic bandwidth tests.
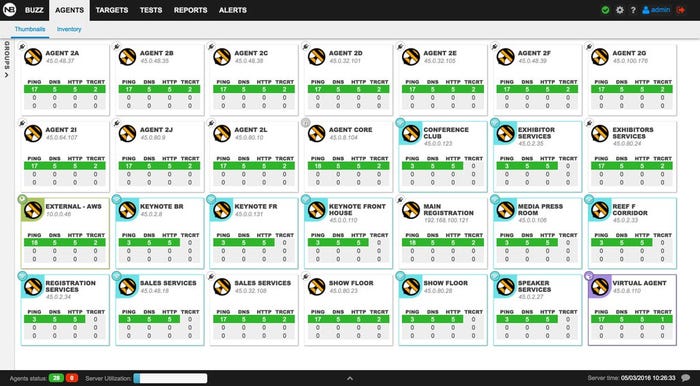
Below is the resulting NetBeez dashboard with all the agents up and running right before the start of the show. You can see the wired, wireless, virtual and external agents all reporting green lights.

2-nb-dashboard.jpg
Overall performance
To capture the real end-user experience and measure network and application performance, we created the following targets:
Full mesh of ping and traceroute tests between the wired, external, and virtual agents
Performance monitoring of the Interop.com and the Netbeez website
Performance monitoring of cloud applications like Salesforce and Google Apps
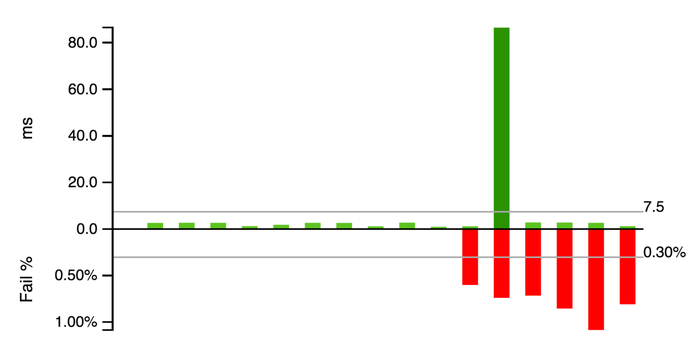
As you can see from the chart below, the average packet loss (in red) was 0.30% while the average round-trip-time for all agents (in green) was 7.5 ms.

3-network-rtt-chart.png
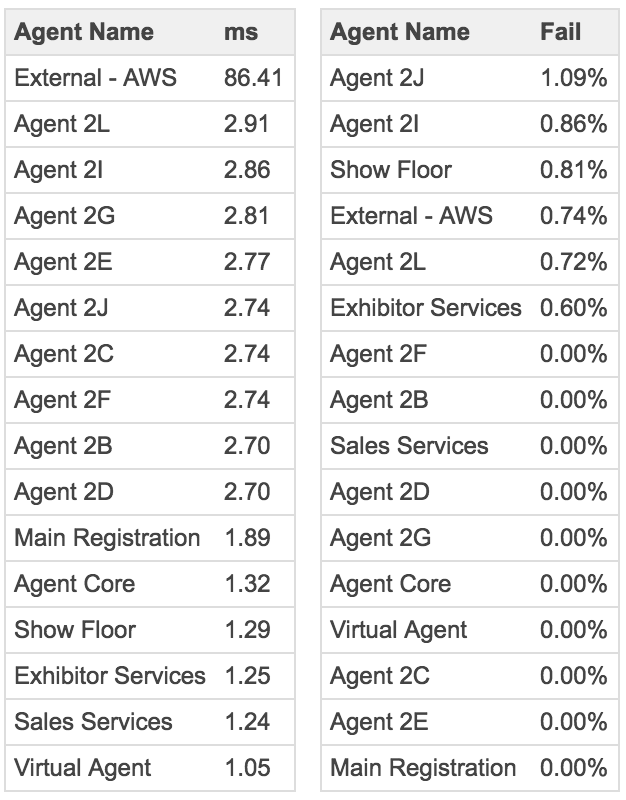
However, the 7.5 ms average round-trip-time value also included the external agent running in the Virginia Amazon Cloud. If we remove that value, we can see from the table below that the average round-trip-time is more realistically around 2 ms.

4-network-rtt-table.png
Network availability
During the busiest days when the show floor was open, Wednesday, May 4th and Thursday, May 5th, the network latency across all the wired agents was very stable. In the line chart below you can see, for each agent, a straight line that represents the round-trip-time between agents on Wednesday and Thursday. The majority of agents had a round-trip-time of around 2 ms. Only one agent, the external one running from AWS, had a significantly greater round-trip-time, at approximately 86 ms.

5-network-rtt-wired.png
Application performance
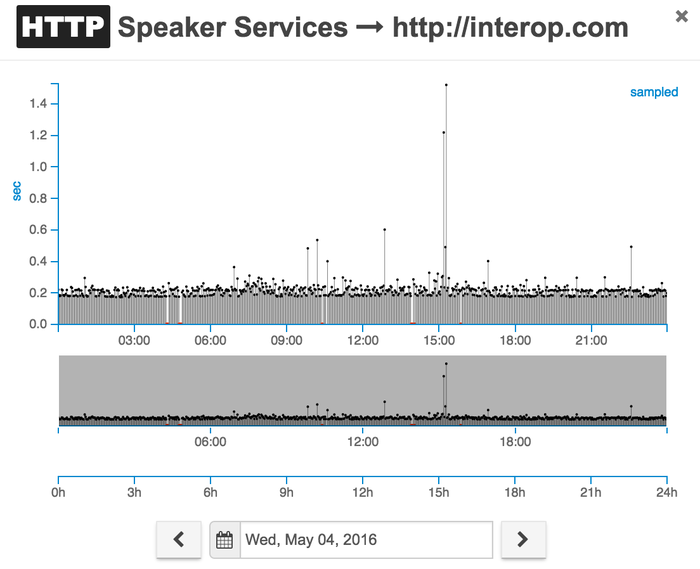
Application performance as detected by the wireless agent was pretty good. The following chart shows that the average HTTP response time for a wireless user connecting to the Interop.com website was about 0.2 seconds.

6-wifi-agent-wed-5-4-16.png
Interop built a high-performing network and provided us with a great opportunity to deploy our solution in a demanding environment. It’s always a pleasure and honor working with the highly qualified NOC team led by Glenn Evans.
About the Author
You May Also Like


